Difference between revisions of "Requirements to Set up a Model"
| Line 4: | Line 4: | ||
{| style="color: black;" width="100%" class="wikitable" | {| style="color: black;" width="100%" class="wikitable" | ||
!colspan=" | !colspan="3"|Without AIS data available | ||
|- | |- | ||
|Sea chart||The sea chart must be in a commonly used picture format like jpg, bmp or tiff. This can be imported into Google EarthTM for defining the grounds. | |Sea chart||colspan="2"|The sea chart must be in a commonly used picture format like jpg, bmp or tiff. This can be imported into Google EarthTM for defining the grounds. | ||
Shipping lanes The most important shipping lanes/legs are drawn in a sea chart. It must be possible to read the coordinates of the legs. | Shipping lanes The most important shipping lanes/legs are drawn in a sea chart. It must be possible to read the coordinates of the legs. | ||
|- | |- | ||
|Ship data||For each leg the number of ships in each direction must be known. this should be in the form of a statistical summary of Ship types and length classes | |Ship data||colspan="2"|For each leg the number of ships in each direction must be known. this should be in the form of a statistical summary of Ship types and length classes | ||
Based on the ship ength, IWRAP extracts the default breadth, draught and speed from an internal statistical database. However the default draught and speed can also be overridden by the user. | Based on the ship ength, IWRAP extracts the default breadth, draught and speed from an internal statistical database. However the default draught and speed can also be overridden by the user. | ||
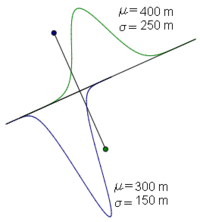
| Line 18: | Line 18: | ||
In many cases a normal distribution will do the job. In that case the mean distance and the standard deviation from the leg must be given. | In many cases a normal distribution will do the job. In that case the mean distance and the standard deviation from the leg must be given. | ||
[[Image:20090407 Normal DistributionTVD.gif | |[[Image:20090407 Normal DistributionTVD.gif|200px]] | ||
|- | |- | ||
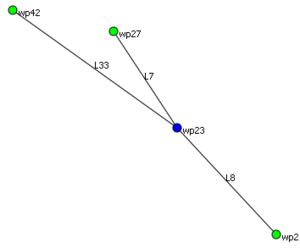
|Junction data||Where legs intersect or split we need to know which fraction sails to which leg. | |Junction data||Where legs intersect or split we need to know which fraction sails to which leg. | ||
For the picture below the following info is | For the picture below the following info is needed | ||
Proportion of ships on leg 8 going from 8 to 7 | Proportion of ships on leg 8 going from 8 to 7 | ||
| Line 39: | Line 39: | ||
The fractions can be based on individual ship types or the total number of ships | The fractions can be based on individual ship types or the total number of ships | ||
[[Image:20090407 Leg Junction.gif | |[[Image:20090407 Leg Junction.gif|300px]] | ||
|- | |- | ||
|Statistics for validation||For validation of the results statistic of the number of collisions and groundings that have occurred in the area within the last 10-15 years or so can be used.|} | |colspan="2"|Statistics for validation||For validation of the results statistic of the number of collisions and groundings that have occurred in the area within the last 10-15 years or so can be used. | ||
|} | |||
Revision as of 09:18, 13 May 2012
The following describes what is needed before a model can be set up.
Without AIS Data Available
With AIS Data and Automatic Extraction Tools Available
(Commercial version - This is not the case for users using the free IALA version of IWRAP).
| With AIS data and Automatic Extraction Tools Available | |
|---|---|
| Sea chart | A sea chart containing depth curves for 0m, 5m and 10m (or close to this). The chart must be in a commonly used picture format like jpg, bmp or tif. It must contain some latitudes and longitudes so that readings can be made. |
| Density plot | If this is available it should be in a commonly used picture format like jpg, bmp or tiff. It must contain some latitudes and longitudes so that readings can be made. Coordinates of the corners of the picture is the best.
A density plot is not required, just nice to have. |
| AIS data | At least 3 month of AIS data for the area. IWRAP calculates frequencies for 1 year, so 3 month of AIS data will be multiplied by 4.
In many cases a sampling time of 6 minutes will do the job. But if the lanes are very curved and the ships are fast the original AIS data should be used. The AIS data must be in one or more text files (CSV files) with at least the following fields: MMSI, IMO, TIME, “NAME”, “DESTINATION”, TYPE_OF_SHIP_AND_CARGO, DRAUGHT, SIZE_A, SIZE_B, SIZE_C, SIZE_D, LAT, LON, COG, SOG Time should be in a format close to DD-MM-YYYY hh:mm:ss
Text fields like Name and Destination should be encapsulated by "" The preferred decimal comma is '.' At least make sure the columns are not separated by the same symbol as the decimal comma. Each CSV-file should not contain more than 1-3 month of data and should be less than 1Gb. |
| Statistics for validation | For validation of the results statistic of the number of collisions and groundings that have occurred in the area within the last 10-15 years or so can be used. |

